Ads 468x60px

Tampilkan postingan dengan label Forex. Tampilkan semua postingan

Sabtu, 05 September 2009

Pair Currency Correlation

This is not originally written by me, it was written by Vahid, about Pair Currency Correlation, I would like to Thanks To Vahid for his great Job to write this article, Because not a lot of Trader wanna share a great Thread like this, another thing a lot of traders thought this is a money maker machine on this industry so they just keep it for their self.


As a forex trader, if you check several different currency pairs to find the trade setups, you should be aware of the currency pairs correlation, because of two main reasons:
1- You avoid taking the same position with several correlated currency pairs at the same time and so you do not multiply your risk. Additionally, you avoid taking the positions with the currency pairs that move against each other, at the same time. 2- If you know the currency pairs correlations, it may help you to predict the direction and movement of a currency pair, through the signals that you see on the other correlated currency pairs.

Holly Grail Trading Sistem

The Trading Mindset
The Holy Grail

The Holy Grail is often referred to in trading circles as the perfect trading system; the perfect conditions or indicator that will guarantee success in every trade you enter. All traders at some stage undertake the search for the Holy Grail whether it is consciously or subconsciously.

The reality of trading is that there is no such trading system in existence. It never has existed and never will. The fact that some software packages label an indicator the ‘Holy Grail’ only serves to whet the appetite of some people further and arouse their suspicion of what it could be and how they will find it.

It is also widely accepted that your own psychology or mindset is the largest single determinant of your trading success followed by your ability to manage risk. The small remainder of the ingredients to your trading success is your system which includes your entry signal.

Applying the MACD to Bearish Reversal Patterns

 The MACD doesn’t measure overbought levels. The MACD is a measure of trend and momentum. When applying the MACD to bearish reversal patterns, the indicator is used to detect when shifts from bullish to bearish momentum occur. These shifts can serve as a leading indicator to a reversal in trend. Additionally, the shift from bullish to bearish momentum can lend credence to a bearish reversal pattern.


Figure 11.20

Basic Candle stik

Candlestick Pattern Formations

Japanese Candlestick charting dramatically increases the information conveyed to the visual analysis. Each candlestick trading formation or series of formations can clearly illustrate the change of investor sentiment. This process is not apparent in standard bar chart interpretation. Each candle formation has a unique name. Some have Japanese names, others have English names.

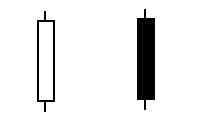
Single candles are often referred to as YIN and YANG lines. These terms are actually Chinese, but are used by Western analysts to account for opposites; in/out, up/down, and over/under. INN and YOH are the Japanese equivalents. YIN is bearish. YANG is bullish. There are nine basic YIN and YANG lines in Candlestick analysis. These are expanded to fifteen to cover all possibilities clearly. The combination of most patterns can be reduced to one of these patterns.

Long days

A long day represents a large price move from open to close. Long represents the length of the candle body. What qualifies a candle body to be considered long? That is a question that has to be answered relative to the chart being analyzed. The recent price action of a stock will determine whether a "long" candle has been formed. Analysis of the previous two or three weeks of trading should be a current representative sample of the price action.